top of page
INTERACTIVE CHART INTERFACE
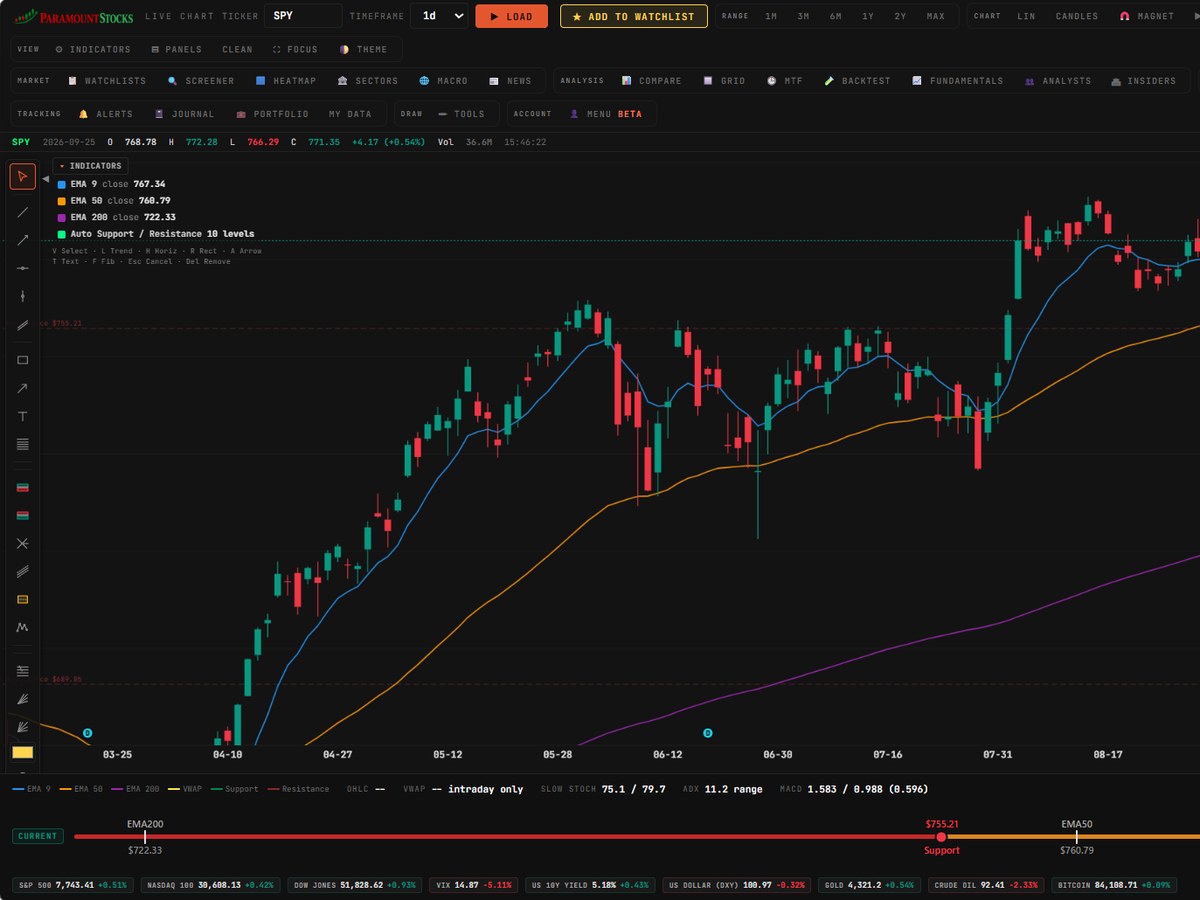
Interactive candlestick charts in your browser, from 1-minute to monthly, with the indicators and tools you need to read price action. Market data may be delayed.


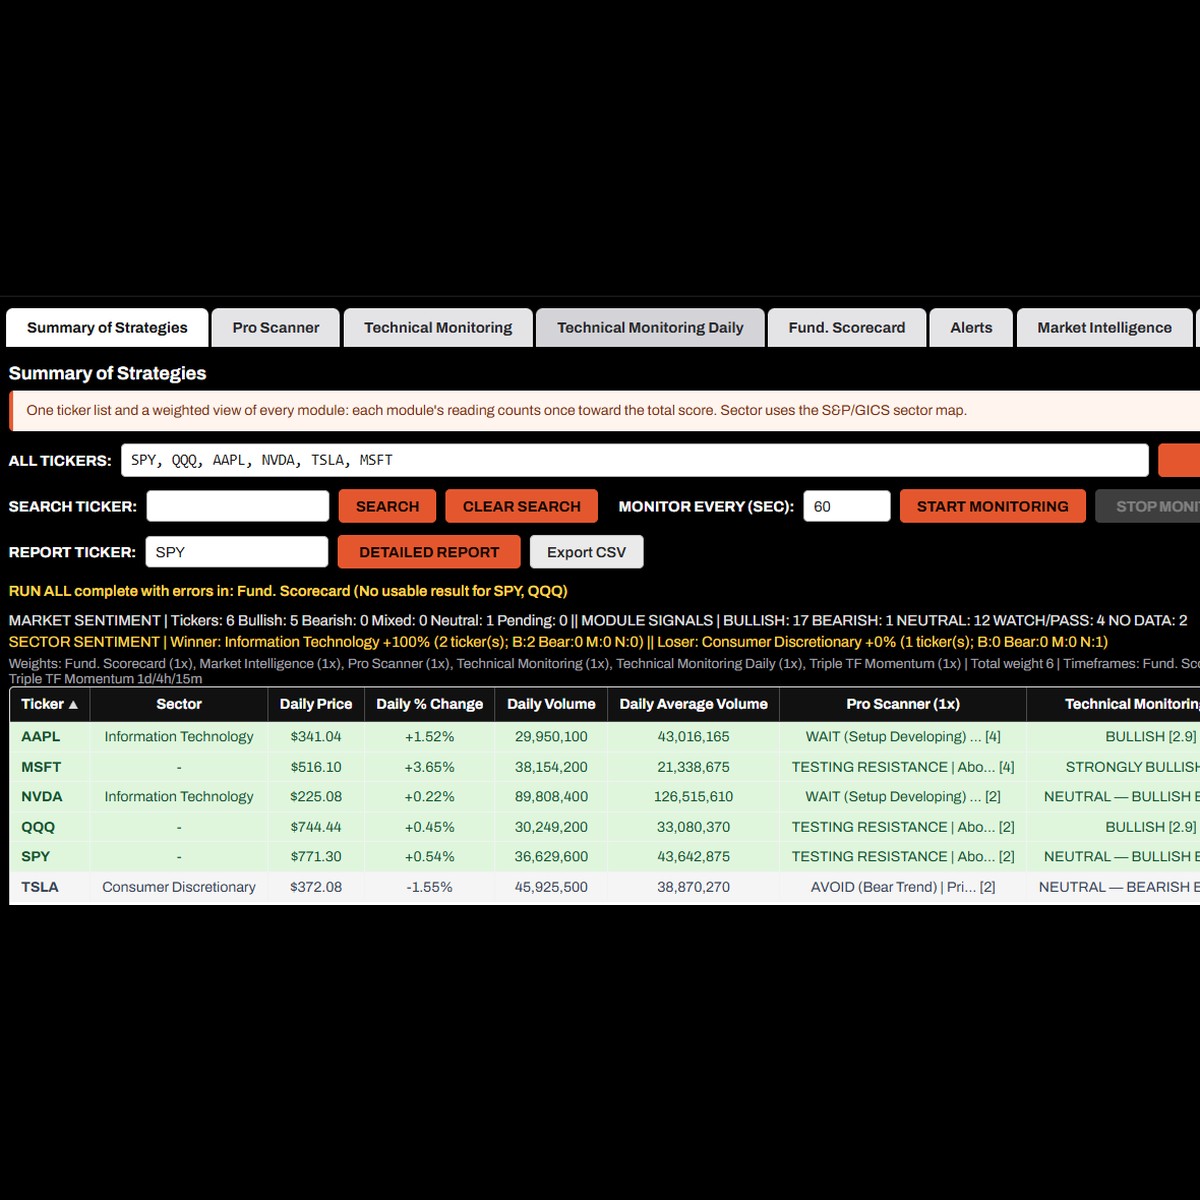
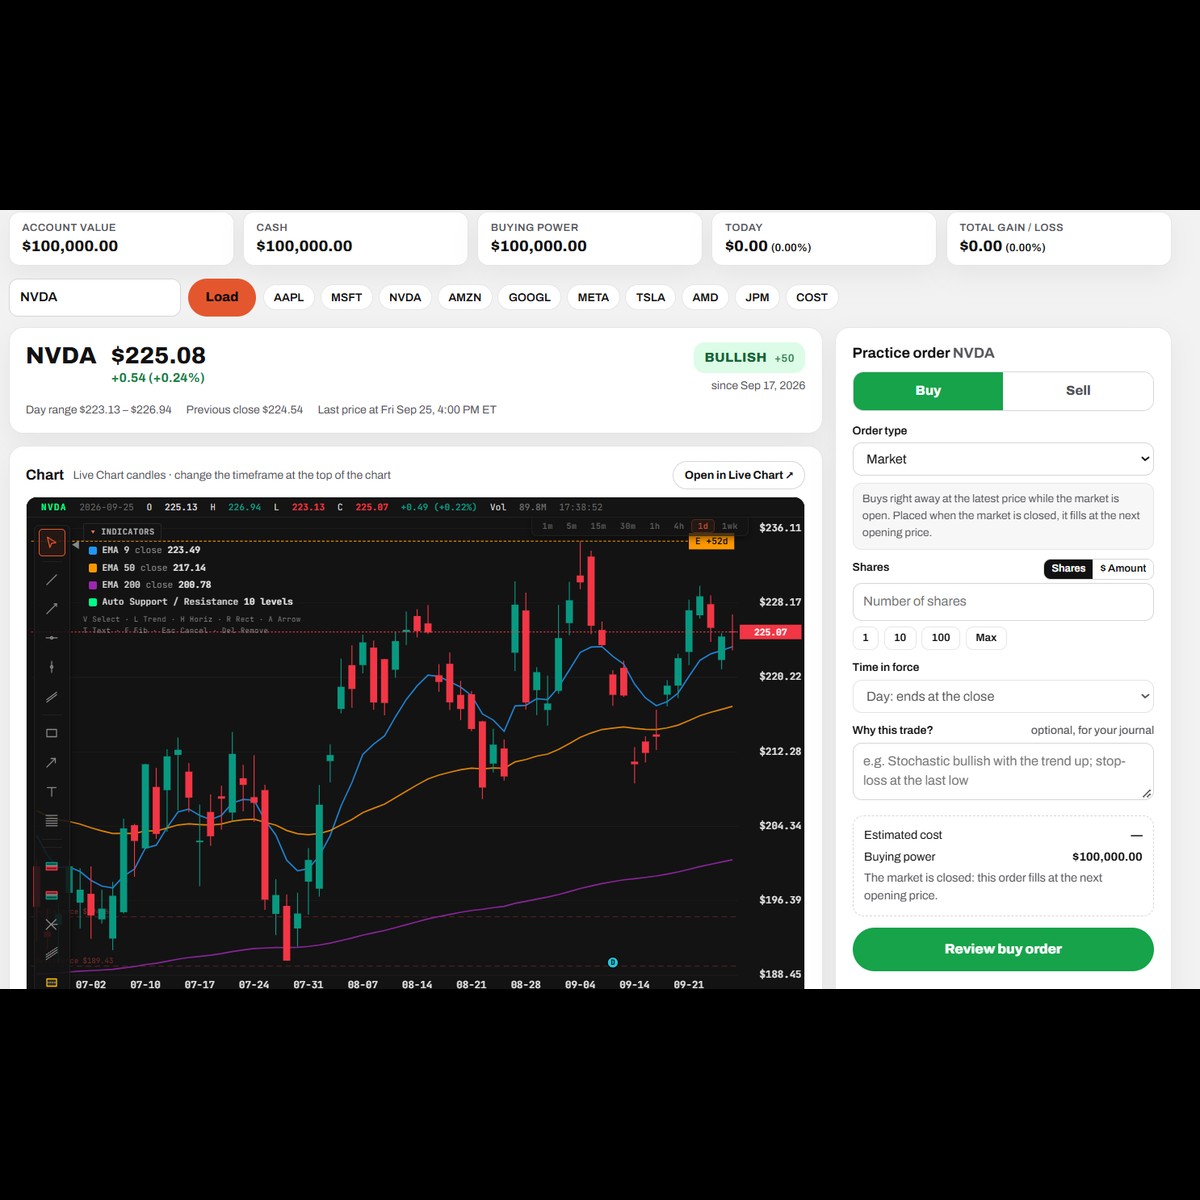
TECHNICAL MONITORING — INTERACTIVE DEMO (SAMPLE DATA)
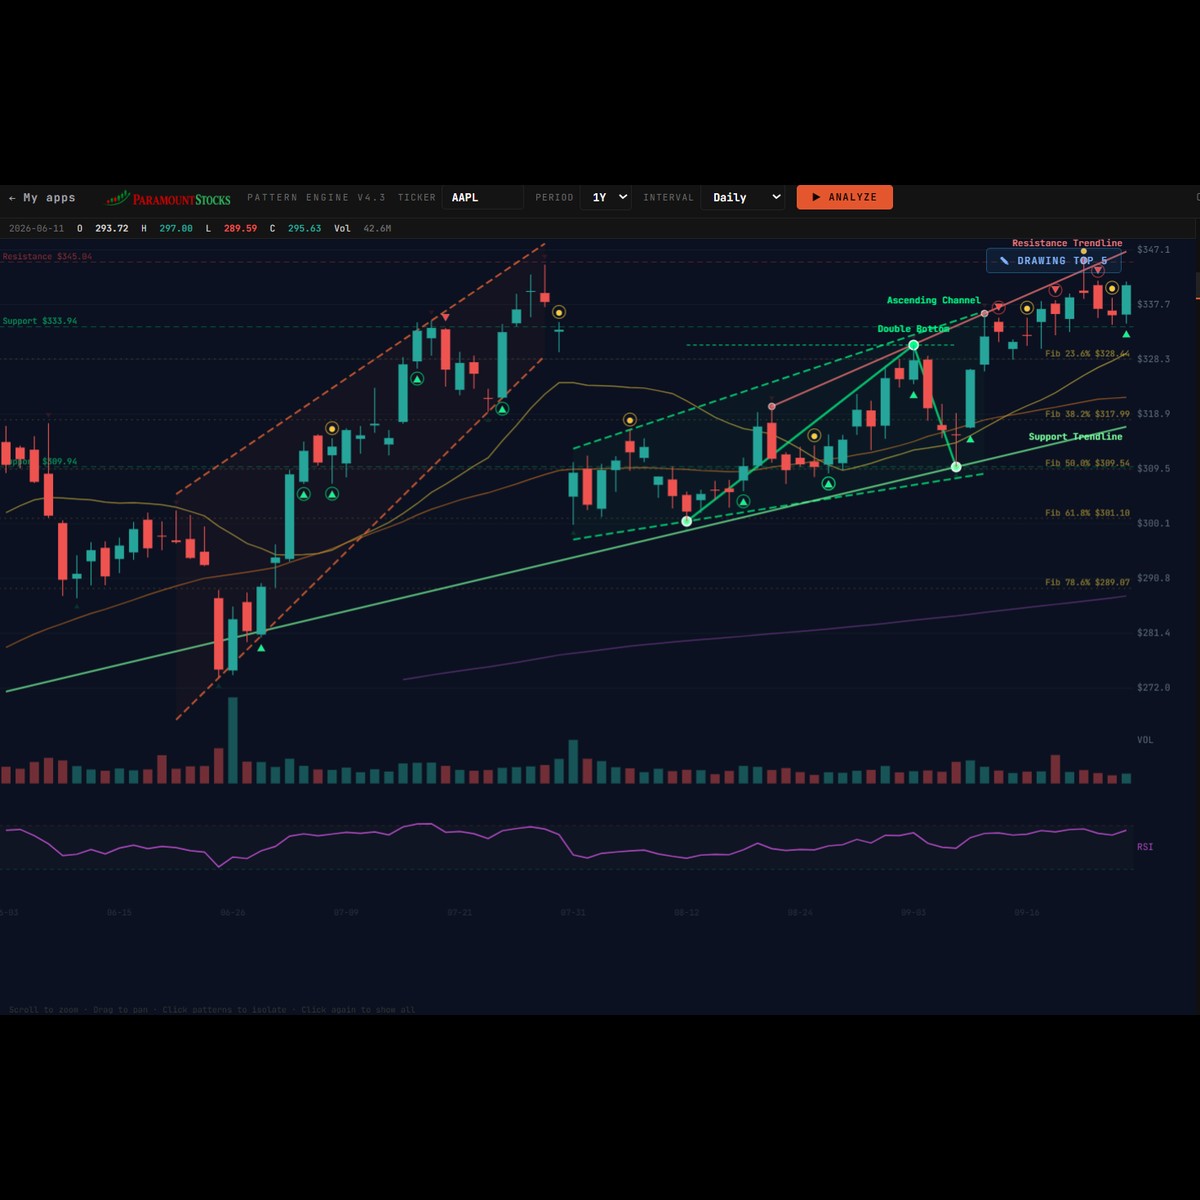
PATTERN ENGINE — INTERACTIVE DEMO (SAMPLE DATA)
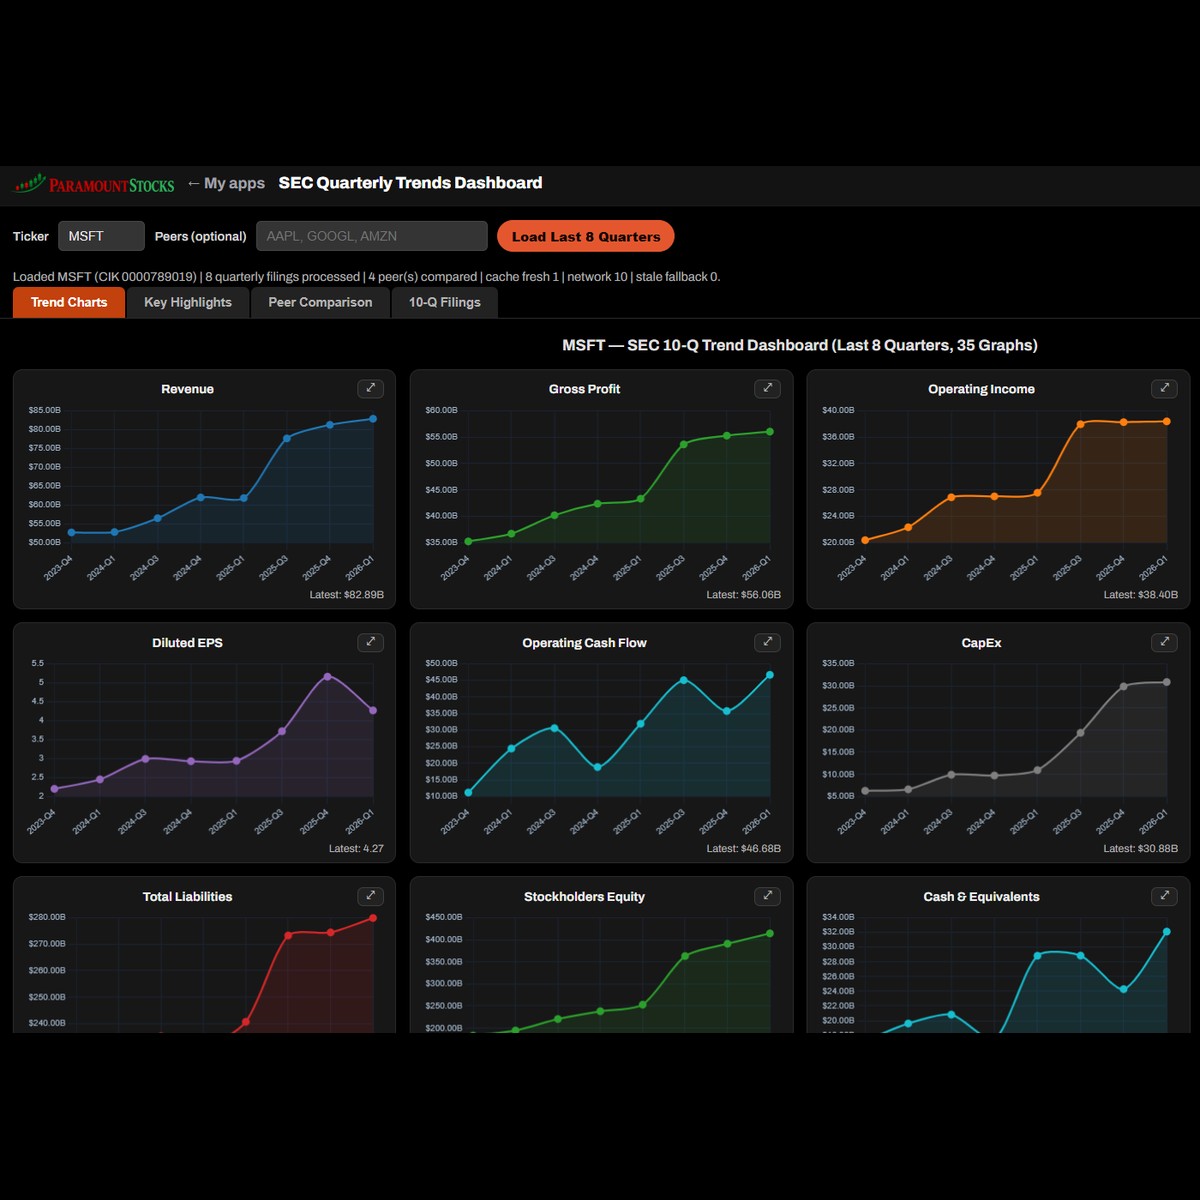
FUNDAMENTALS (SEC QUARTERLY TRENDS) — INTERACTIVE DEMO (SAMPLE DATA)
PRACTICE PORTFOLIO — INTERACTIVE DEMO (SAMPLE DATA)
bottom of page